AugustUpdate Camp News |
Staff Rankings
| Config Cheat Sheet
| STOMP
Draft Strategies | Depth Charts | Mock Drafts | SOS | Tools | ADP
Diehards Staff Experts Poll | Draft Simulator | University Videos
Draft Strategies | Depth Charts | Mock Drafts | SOS | Tools | ADP
Diehards Staff Experts Poll | Draft Simulator | University Videos
Strength of schedule and breakout predictor, 2017—2018
By Adam Hall

What’s the best way to succeed that no one considers?
When you close your eyes and think hard about what makes for a successful fantasy team what comes to mind? An elite quarterback, a receiving corps like the Giants perhaps? Or maybe it’s an offensive line like the Cowboys from last year? All of these factors are important for a team to be successful, but if you want to be a successful fantasy football player, you can’t depend on information that everyone has access to. Everyone knows that OBJ, and Brandon Marshall are great receivers, while everyone and their brother knows that Aaron Rodgers is a bad man.Though the main constant that very few people put stock in, is the opportunity tied to every team by the quality of the opponents they will face in the upcoming year. Over the last four years I have developed a statistical model to predict how each team will do based on an off-season adjusted strength of schedule. In these articles, I’m going to walk you through what has gone into this model and will end with who you should consider targeting this year in your draft, along with which teams are most likely to have a break out star emerge throughout the season.
How does this model work?
Just last year through this model I was keyed into players like: Jordan Howard, Kirk Cousins, Terrell Pryor, Ty Montgomery, Mike Wallace, and Isiah Crowell. I picked many of these players up off of waivers or as flyers at the end of many of my re-draft leagues. Fundamentally, this model gives you a heads up on value on year-long basis. Let’s take a quick tour through what comprises these statistics.A normalized look at last year’s performance.
It all starts with normalizing each team’s team defensive performance from the year prior. We start with yards allowed by each team on the ground and through the air, and we end with a normalized value that brings everyone on a level playing field, to see who excelled and who failed. This normalization is based on standard deviations; it ends with a great defensive team like the Broncos scoring a -2.67 passing rating (2.67 standard deviations better than the normal number of yards allowed through the air), and a horrible defensive team like the 49ers scoring a +3.08 rushing rating (3.08 standard deviations worse than the normal number of yards allowed on the ground).This is repeated for three crucial standards, and weighted (multiplied by) according to their perceived reproducibility. The standards are listed in order of importance: yards per catch/carry, yards allowed through the air/ground, and finally, points allowed through TDs against the defense. Once these weighted variables are combined, this gives us a number that spells out the real best and worst defenses in the NFL last year.
Measuring changes to predict future trials and tribulations.
The NFL is known for year to year parity, where a recently poor team leap-frogs the teams that trounced them just the year prior. This is because the robust free agency, draft, and coaching change culture that runs rampant through the veins of the NFL. The Giants last year epitomized this standard by buying an entire defensive line, and going from one of the worst three running defenses in 2015, to top five in 2016. While the great 49ers exodus in 2014 showed that you can take a top-three defense and make it historically bad in a single off-season.My model quantifies every change that occurs in the off-season and factors that into the standardized number that was described above. Using pro-football focus’s player grades, personal rookie scouting, expert rookie consensus, and historical success of coaches, I increase or decrease the standardization rating based on loses and gains in the off-season. This leaves us with a spread of scores that are much more likely to mesh with success in the future, than just going off of prior performance.
A couple examples of big changes this year include: The Cowboys losing their entire secondary, the Packers losing more than half of their front seven, the 49ers boosting their depth and talent all throughout the front-seven, and the Bills losing two-thirds of their defense.
My model’s strength comes from accounting for each and every move. Hopefully, this project can bring you, dear reader the same kind of success it has brought to me over the years.
How do use the model
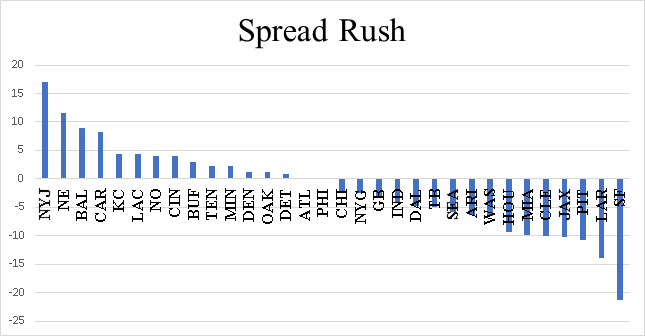
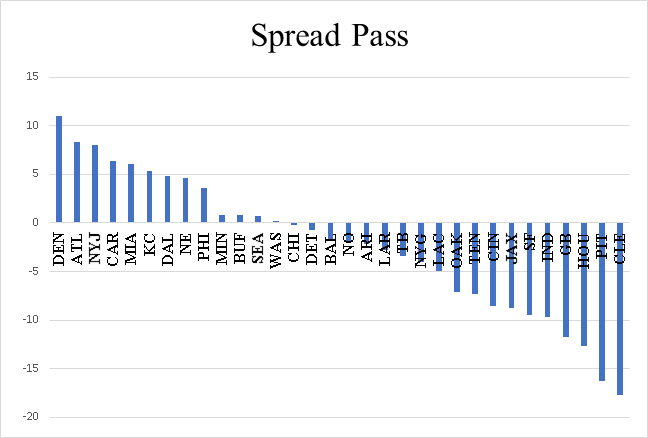
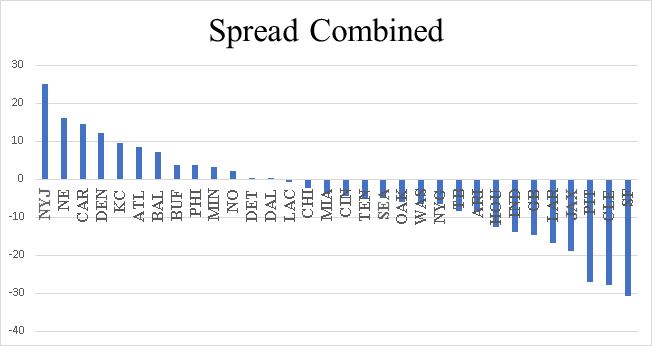
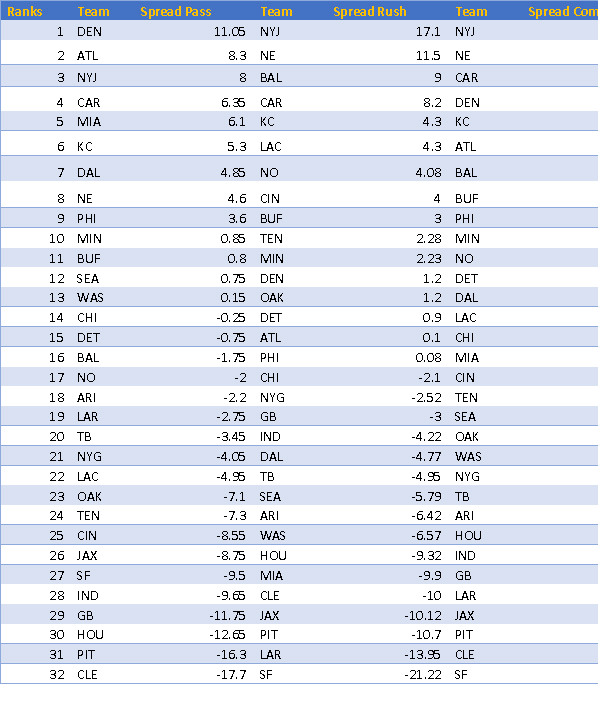
Below are the final outcomes for the strength of schedule and breakout predictor model. Negative scores indicate a schedule filled with above average defenses specializing at either rush or pass, while positive scores indicate a schedule filled with comparatively easier defenses. There are scores for passing, rushing, and a combined strength of schedule. A wise player would optimize their draft by picking from teams with positive ratings. The model is best exploited by picking out values from each of the positively graded teams. Though remember, that this model skews negative, so picking from any teams at rank 16 or above increases your likelihood of success even if those teams have a slightly negative schedule, like the Chicago Bears at the RB position. This is not something that you’ll want to make a habit of, but if you love the upside of a player, don’t let a small negative score impact your choice.Players like: Blial Powell, Terrance West, Austin Hooper, Devante Parker and Emmanuel Sanders are screaming to be picked three rounds later than their value will pay out.
In the coming articles we’ll discuss who will have the easiest along with most difficult paths to success in 2018, along with an optimized version of the model that includes offensive line productivity.
The higher the score, the easier the schedule:


